Data Visualisation

Data Visualisation

Discover the potential of your data with our bespoke enterprise-grade data analytics services, data analytics consulting and other solutions.

Playtime Solutions offers premium data visualisation services to Australian businesses that want to make their business data easier for their clients and staff to understand. Our data visualisation consulting team has many years of experience working with businesses from different industries and can assist them by implementing reporting software that will create a dynamic data visualisation dashboard, presenting all data in a comprehensive yet visually easy to understand manner.

What is Data Visualisation?

Data visualisation is the process of using a data analytics pipeline to obtain, analyse, store and organise information from large volumes of text data and transform it into some type of visually dynamic data visualisation dashboard, such as a table, chart, graph or map. As it is far quicker and easier for the human brain to process visual data compared to written reports and spreadsheets, presenting complex data in a visually understandable way can help business owners make smart decisions about how to go forward with their business.

Benefits of Data Visualisation

Makes Data Easier to Understand

A clearly outlined and visually dynamic data visualisation dashboard that presents data using defined charts and colours makes it much easier for business owners to see what the data is showing. By looking at the patterns and trends that are occurring, business owners can see which processes of theirs have been successful and which have been unsuccessful.

Visually Appealing

Most humans tend to more quickly understand visual data such as graphs, charts, tables and maps compared to written and numerical data. By having a visually simple and dynamic data visualisation dashboard that includes such visual data, businesses owners can proceed with fewer issues.

Streamlines Decision Making

Using a clear and concise data visualisation dashboard can help business owners and their staff to understand trends and patterns and use this data to make decisions about what’s working and what needs to be improved. Having a better understanding of such data allows teams to implement smart decisions.
Approach
SSRS vs Power BI vs Fabric

SSRS

  • SSRS is reporting software that produces, manages and publishes reports in accordance with its programming and coding interface.
  • SSRS is accessible via both the internet and desktop platforms.
  • There are no data size limits.
  • Only server-based reports are generated.
  • Microsoft updates SSRS at different points of time over the years.

Power BI

  • User friendly.
  • Wider range of graphical and visualisation tools.
  • Power BI visualisation software is an open-source HTML5 and cloud-enabled Software as a Service (SaaS) solution.
  • Power BI visualisation software can produce both cloud-based and server-based reports.
  • A data limit of 1 GB when the free version of Power BI visualisation software is used.
  • Power BI visualisation software can extract data from almost anywhere.
  • Power BI visualisation software is updated with new features and services every month.

Fabric

  • Microsoft Fabric can be used for data lake, data engineering and data integration applications, meaning users do not have to use multiple programs.
  • Microsoft Fabric integrates various technologies, including data engineering, data science, real-time analytics and Power BI visualisation technology on a shared SaaS platform to store data in one location.
  • Transforms and prepares data so it’s clear and can be easily analysed.
  • Improves both security and accessibility.

Playtime Green Competitive Edge

Industries We Serve​

  • Education ​
  • Healthcare​
  • Manufacturing & logistics​
  • Government ​
  • Retail​
  • Energy & utilities​
  • Financial services

Contact Us Today

Playtime Solutions is a data visualisation consulting firm that can assist businesses Australia wide with the data visualisation services they need. Submit an online enquiry today.

Data Engineering & DataOps Services

Secure, bespoke enterprise-grade data solutions at every stage of the data lifecycle.

data-platforms
Data Platforms
data-analytics
Data Analytics & Visualisation
data-engineering
Data Engineering & MLOps
datascience
Data Science
data-strategy
Data Strategy & Consulting
Strategic Technology Partners

We are proud to have strategic partnerships with leading technology providers. Our industry experts and technical engineers are qualified and experienced in a range of leading technologies.

Other Services
Icon Platform Modernisation

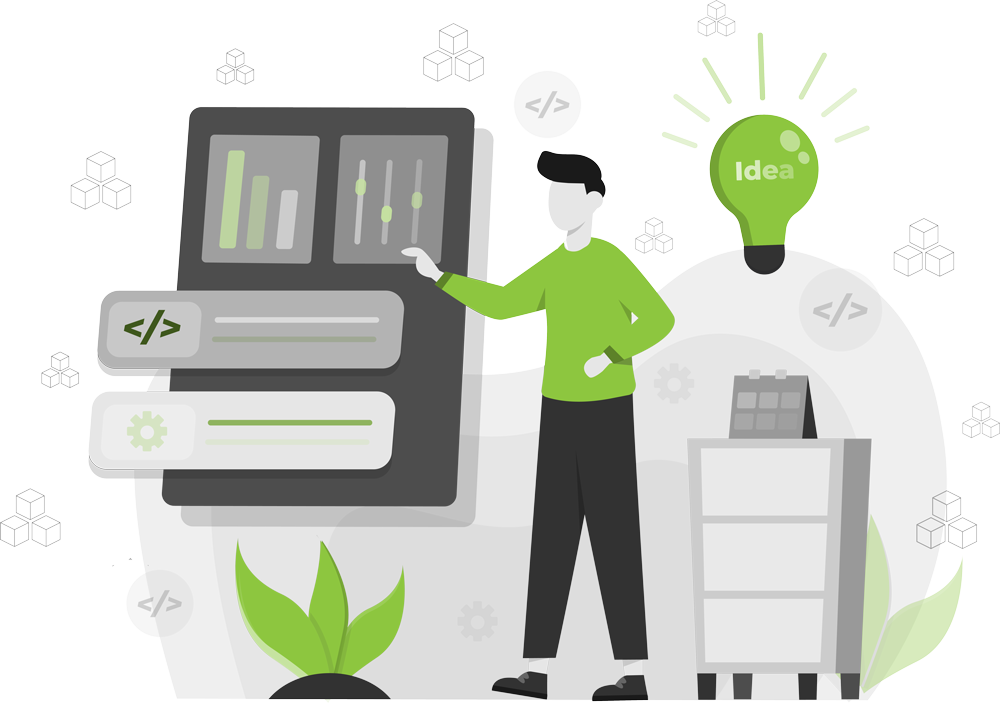
Platform & Infrastructure Modernisation

Arm your development team with a bespoke well-architected platform environment. Empower them with the right tools to innovate.

Icon of Data Modernisation

Data Analytics & AI

Tap into uncharted territory and harness the wealth of information at your fingertips through Data Analytics, visualizations & insights.

consulting-technical-advisor-icon

Consulting & Technical Advisory

Our outcome-based approach ensures that strategies, roadmaps, and recommendations are practical and achievable.

Download Best WordPress Themes Free Download
Free Download WordPress Themes
Download Nulled WordPress Themes
Download WordPress Themes Free
udemy free download
download xiomi firmware
Download WordPress Themes Free